Availability Tools
Availability is Different
Of the CIA triad of information security —
Confidentiality, Integrity, and Availability
— this one is different.
We have encryption for confidentiality.
This is defensive cryptographic technology,
attempting to prevent an adversary from reading our
information.
It cannot guarantee that an adversary could not discover
the decryption key or otherwise obtain our information.
However, it makes that attack very difficult.
We have cryptographic hash functions for integrity.
This is detective cryptographic technology,
attempting to tell us if an adversary has modified our
information.
It cannot guarantee that an adversary could not somehow
modify our information in a way that its content has
different meaning but we do not notice this.
However, it makes that attack very difficult.
We have specific numbers in both cases for how much work
it would take to successfully attack us.
Attacks will always be possible in theory, but we can make
them hard enough in practice that we do not need to worry.
Unfortunately, we have no cryptographic tools
for availability.
This means that we have no math, and so we have no numbers.
We cannot rigorously prove the likelihood of data or any
other resource remaining available.
We cannot even say that any one data set is
more available than another.
The best thing we have is statistics on what has happened so far in a similar setting. If someone reports that a specific type of storage media has "a lifetime of 2 to 5 years", what they are really saying is that in some percentage of similar cases, maybe 95% of them, maybe 99% of them, the data was available for between two and five years. In a few cases, it did not last even two years, and in a few other cases it may have lasted for more than five. All you really know is that if you use a large number of these storage devices, most of your data will probably still be around two years later. And, after five years, significant amounts of your data will probably start to disappear.
Availability simply cannot be guaranteed. Any unprivileged user on a Unix-family operating system can type the following:
$ a() { a|a & } ; a
That defines a shell function a()
which immediately calls itself and pipes its output
into a second copy of itself.
And then that short line of code calls that disastrous function.
That would recurse down an endless hole, doubling the
number of processes at each level.
On Solaris 9 that immediately freezes the system.
On Linux with a 3.* kernel and a typical amount of RAM, you would have about one second before the system freezes.
On OpenBSD the system freezes for a few seconds before the kernel steps in and kills the out-of-control set of processes.
On Linux with a 4.* and later kernel, the system freezes for a few seconds, then is very sluggish for several seconds while a blizzard of error messages fly up the screen where you did this, a mix of:
-bash: fork: retry: No child processes
and:
-bash: fork: retry: Resource temporarily unavailable
The load average can climb over 100 within a few seconds.
I tested this on a Raspberry Pi with only 512 MB of RAM
and a single-core CPU.
In another terminal window where I was connected in over SSH,
I ran "top -d 0.2" to observe the freeze,
the sluggishness, and the load average spike.
The systemd project is taking over more and more of the Linux operating system environment. Thanks to its reckless design, you may be able to freeze a system with this single line:
$ NOTIFY_SOCKET=/run/systemd/notify systemd-notify ""
See that attacks's explanation here, along with discussion of how systemd's creeping takeover of the Linux operating system may be a very bad idea.
Also see this "Compiler Bomb",
a 29-byte C program that compiles to a
17,179,875,837 byte (or 16 GB) executable.
We must pass the -mcmodel=medium option
because the array is larger than 2 GB,
and possibly the -save-temps option to keep
temporary files in the local directory if there isn't
enough space in the /tmp file system.
During attempted compilation by any unprivileged user,
the system becomes sluggish from time to time as
memory is exhausted.
See the
Compiler Bomb
page and the
original discussion
for more details on this.
$ cat cbomb.c
main[-1u]={1};
$ gcc -mcmodel=medium cbomb.c -o cbomb
cbomb.c:1:1: warning: data definition has no type or storage class
 main[-1u]={1};
  ^
/tmp/ccZbsIhp.s: Assembler messages:
/tmp/ccZbsIhp.s: Fatal error: cannot write to output file '/tmp/cc5mxHSz.o': No space left on device
$ time gcc -mcmodel=medium -save-temps cbomb.c -o cbomb
cbomb.c:1:1: warning: data definition has no type or storage class
 main[-1u]={1};
  ^
/usr/bin/ld: final link failed: Memory exhausted
collect2: error: ld returned 1 exit status

real    2m16.169s
user    0m4.512s
sys     0m12.573s
$ ls -l
total 16777232
-rw-rw-r-- 1 cromwell cromwell          15 Oct 19 10:18 cbomb.c
-rw-rw-r-- 1 cromwell cromwell         143 Oct 19 10:23 cbomb.i
-rw-rw-r-- 1 cromwell cromwell 17179870214 Oct 19 10:26 cbomb.o
-rw-rw-r-- 1 cromwell cromwell         219 Oct 19 10:23 cbomb.s
Then there's a "Zip Bomb", which expands into a surprisingly large file and fills local storage. David Fifield described how to create such files. The last one in this table requires Zip64, and so it's less portable. If you also use recursive zip files, infinite expansion is possible with a small file.
| zipped | unzipped | expansion |
| 42 kB | 5.5 GB | ~129,000× |
| 10 MB | 281 TB | ~28,000,000× |
| 46 MB | 4.5 PB | ~98,000,000× |
Internet traffic travels over submarine cables,
most with multiple very high bandwidth fibre optic lines.
Fishing trawlers can cut these.
Vietnam, where over 50% of the people are on the Internet,
seems to have more problems than most countries.
The cables joining Vietnam to Hong Kong, other Chinese
landing points, and the Philippines are frequently cut,
often near the far end.
Submarine cable and satellite outages
Errors or intentional attacks on IP routing can misdirect
traffic.
This can be a denial of service.
It is frequently used within a country for political reasons
in parts of Asia and Africa.
Or, it could be for espionage or other traffic collection.
BGP hijacking and accidental routing blunders
Finally, we can't defeat nature, especially when we're
overly reliant on limited facilities.
Storms can disrupt supply chains.
2018: 30-minute power outage at Samsung factory
near Pyeongtaek destroyed 3.5% of global
v-NAND flash memory output for March
2011: Floods in Thailand led to hard drive
shortages for months
Table of Contents
Some topics have their own page.
On this page:
Detailed topics with their own pages:
Netflix As An (Extreme) Example
Netflix has created the Chaos Monkey
and other elements of its Simian Army
to stress its system to test resiliency.
It's very surprising that they unleash these
tools on their production systems,
tell people about this, and even give away the tools.
See the
Netflix technical blog
for details.
Netflix technical blog
Netflix is largely built on the Amazon Web Services public cloud. The Chaos Monkey disables selected production systems, while the Chaos Gorilla takes out an entire AWS availability zone. The Doctor Monkey does automated alert and response, searching Netflix's resources for any degradations in performance.
Where not to place telco pedestals
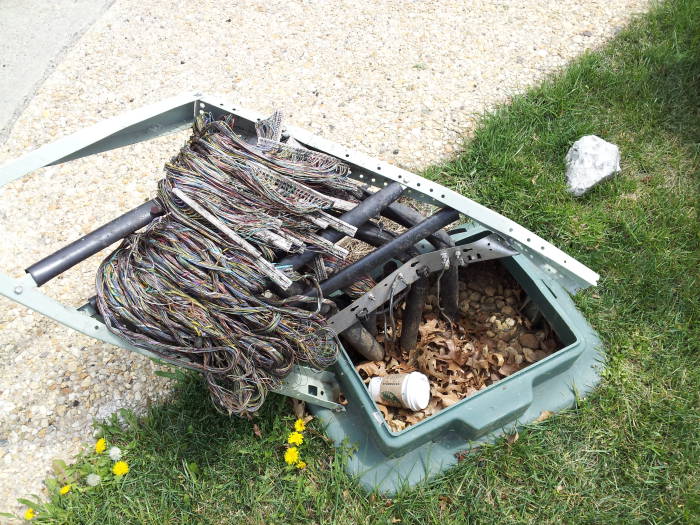
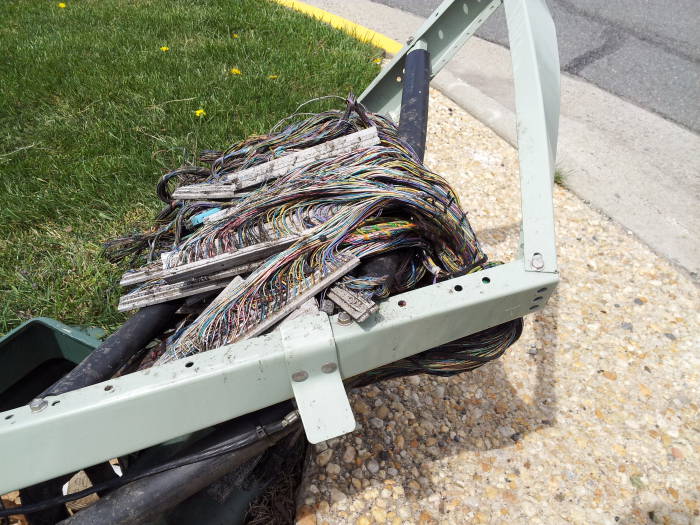
Do not place them where this one was in Herndon, Virginia — right along a road winding through office parks, where the anxious commuters hit speeds around 50 m.p.h. despite that being almost twice the posted limit.
And especially not where a sidewalk ramp makes it so easy to drift off the road while texting and smash into the poor pedestal.


Data Loss Costs
National Archives and Records Administration (Washington DC, USA)
93% of companies that lost their data center for 10 days or more due to a disaster filed for bankruptcy within one year of the disaster.
50% of businesses without data management for this same period filed for bankruptcy immediately.
Cyentia Institute
- The median loss for incidents meeting our qualifications for “extreme” is $47M, with just over one-in-four exceeding $100M; five events racked up $1B or more in losses. Moving beyond mega-corporations, the probability of cyber incidents drops substantially. SMBs have breach rates below 2% and are orders of magnitude less likely to suffer several in a year.
- Relative to annual corporate revenues, losses from these events range from less than 0.1% to nearly 100 times the affected firm’s revenue!
-
Response costs, lost productivity, and fines and
judgements are the most common forms of loss
in extreme events.
[...] -
Apart from hard costs, 27 events were reported in
U.S. Securities and Exchange Commission (SEC)
filings, 25 triggered executive changes,
and 23 prompted government inquiry.
[...] -
Stolen passwords and other credential-related
attacks led to more incidents (46) and more
total losses ($10B) than any other
threat action.
[...] - Web application attacks placed third in frequency (25 events; $2B), but exploitation of known and patchable vulnerabilities ranked third in cost (22 events; $8B).
100 Largest Cyber Loss Events of 2015-2020
Symantec and Ponemon
Symantec conducts a periodic study of disaster recovery plans and estimated costs. Using their 2009 report as an example, they surveyed disaster recovery management at 1,650 companies worldwide, each with at least 5,000 employees and a current disaster recovery plan. They collect a lot of data, but they summarize and present it differently from year to year so you can't necessarily track a given statistic through the years.
According to Symantec's 2009 Cost of Downtime Survey Results:
93% of organizations reported that they have had to implement their disaster recovery plans, either in full or partially.
They could achieve skeleton operations after a site-wide outage in a median of three hours, and get mostly back up and running in about four hours.
Based on the reported recovery time and the cost per hour of downtime (not listed in the 2009 report), the cost per incident globally averages approximately US$ 287,000 and the median cost per incident can be as high as US$ 500,000.
IT is becoming more critical over time, with 56% of applications deemed mission critical in 2008 and 60% in 2009.
Database servers are the most likely technologies covered by disaster recovery plans, at 62%, closely followed by applications and web servers, at 61% each.
As for the cause of needing to implement
those disaster recovery plans:
59% Computer system failure
54% External threats (malware, hackers)
53% Natural disasters (fire, flood)
45% Power outage / issues
43% User/operator error
39% IT problem management
37% Data leakage or loss
36% Malicious employee behavior
34% Configuration change management issues
33% Man made disasters (e.g., war, terrorism)
26% Configuration drift issues
7% Never
I am skeptical of this data.
Seriously, 33% of these companies had
their IT operation taken down by
war and terrorism?
Those DR managers were being much
too broad in their interpretation of
"man made disaster"!
That category is stealing significant
credit away from user / operator
error, and some from IT problem
management, configuration change
mismanagement, and configuration drift.
Also, "data leakage or loss" seems to
me to be a result, not a cause.
Interestingly, and alarmingly, companies reported backing up only 37% of their data in virtual environments. Slightly over 25% reported that they do not test their virtual servers.
Symantec and the Ponemon Institute's 2013 Cost of Data Breach Study: United States reported that, counter to assumptions, the cost of a data breach continues to decline. I don't know if that should be attributed to people being tired of hype, or getting a little better at analyzing breaches, or what.
Malicious or criminal attacks cause more breaches than negligence or "system glitches", whatever those are.
They say that having formal incident responses in place before the incident lower the overall cost. Also listed as reducing breach cost are: "having a strong security posture", appointing a CISO or Chief Information Security Officer, and hiring outside consultants to assist with the response. And guess what the authors of that report can help you with!
CA Technologies
CA Technologies issued a 2010 report "The Avoidable Cost of Downtime" reporting that European organizations with more than 50 employees collectively lose more than €17 billion in revenue each year due to the time taken to recover from IT downtime, a total of almost 1 million hours or 14 hours per company per year. On average, each company loses €263,347 per year. The average loss per organization varied all over the place, from €500,000 in France, just under €400,000 in Germany, and just over €300,000 in Spain and Norway, to about €90,000 in Belgium and just under €34,000 in Italy
| Hardware or Systems Malfunction | 59% |
| Human Error | 28% |
| Software Program Malfunction | 9% |
| Viruses | 4% |
| Natural Disaster | 2% |
This table shows the causes data loss according to Ontrack engineers (who seem to have lost no data to malicious intruders):
According to a Gallup poll, most businesses value 100 megabytes of data at US$ 1,000,000.
Laptop Theft Prevention
Security cables:
Kensington
Philadelphia Security Products
American Power Conversion
PC Guardian
Secure-It Inc
"Phone home" style laptop tracking,
Windows only as far as I know:
PC PhoneHome
zTrace
ComputracePlus
Spam, or Unwanted Junk E-Mail

It's a denial-of-service attack. It wastes your network bandwidth, your mail server processing time, your storage, and your employees' time.
BULC CLUB is a great service providing unlimited email forwarding and filtering. It blocks spam, protects your privacy and identity, and helps you better organize your email.
The best user-desktop-based anti-spam tool I have used is Spam Assassin. However, you really want to fight spam on mail gateways, not user endpoints.
IronPort seems to be a very good anti-spam system, based on my observations as a user of e-mail at some ISPs and Purdue University.
Cloud-based mail providers like GMail offer good spam and malware filtering.
Several free spam filters are listed at: paulgraham.com.
How can you tell where spam was injected? Read the "Received:" fields in reverse, looking for inconsistency where the promiscuous relayer accepted the spam from the source. Using a real example I received, my comments are inserted below the relevant lines in red:
	From Bio-Med5241_a@linux.com.pk Thu Oct 26 15:38 EST
No, the message did not come from Pakistan (.pk), see below
	Received: from sclera.ecn.purdue.edu (root@sclera.ecn.purdue.edu [128.46.144.159])
		by rvl3.ecn.purdue.edu (8.9.3/8.9.3moyman) with ESMTP id PAA16066
		for <cromwell@rvl3.ecn.purdue.edu> Thu, 26 Oct 15:38:34 -0500 (EST)
Hop #3 — sclera forwarded my mail to rvl3.ecn.purdue.edu
	From: Bio-Med5241_a@linux.com.pk
	Received: from glasgow3.blackid.com ([212.250.136.251])
		by sclera.ecn.purdue.edu (8.9.3/8.9.3moyman) with ESMTP id PAA13819
		for <cromwell@sclera.ecn.purdue.edu>; Thu, 26 Oct 15:38:24 -0500 (EST)
 Hop #2 — glasgow3.blackid.com, the spam relayer, hands the spam to sclera.ecn.purdue.edu
	Date: Thu, 26 Oct 15:38:24 -0500 (EST)
	Message-Id: <XXXX10262038.PAA13819@sclera.ecn.purdue.edu>
	Received: from geo5 (host-216-77-220-220.fll.bellsouth.net [216.77.220.220])
		by glasgow3.blackid.com with SMTP (Microsoft Exchange Internet Mail Service Version 5.5.2650.21)
		id 449GZRTV; Thu, 26 Oct 21:33:01 +0100
Hop #1 — glasgow3.blackid.com, the spam relayer, accepts mail from the source,
a dial-in client of bellsouth.net using the IP address 216.77.220.220.  The
dial-in client undoubtedly got its IP address via DHCP, and so any system using
that IP address right now is not necessarily the original spam source.  However,
bellsouth.net should be able to figure out which of their clients used this
IP address at this particular time.
	To: customer@aol.com
That's odd — I'm not sure how they're getting SMTP to send it to me but with this
bogus address in the "To:" field — maybe I was a blind carbon-copy recipient...
	Subject: A New Dietary Supplement That Can Change Your Life....
	MIME-Version: 1.0
	Content-Type: text/plain; charset=unknown-8bit
	Content-Length: 5463
	Status: R

	[ long pseudo-medical nonsense deleted.... ]
Further investigation could use traceroute or
whois to figure out where 216.77.220.220 really
is in case the reverse resolution above either failed
or was faked.
As per the GNU version of whois
% whois 216.77.220.220
NetRange:   216.76.0.0 - 216.79.255.255
CIDR:       216.76.0.0/14
NetName:    BELLSNET-BLK5
NetHandle:  NET-216-76-0-0-1
Parent:     NET-216-0-0-0-0
NetType:    Direct Allocation
NameServer: NS.BELLSOUTH.NET
NameServer: NS.ATL.BELLSOUTH.NET
Comment:
Comment:    For Abuse Issues, email abuse@bellsouth.net. NO ATTACHMENTS. Include IP
Comment:    address, time/date, message header, and attack logs.