Archaeology Applications for 3-D Data Collection, Analysis, and Applications
Archaeology Applications
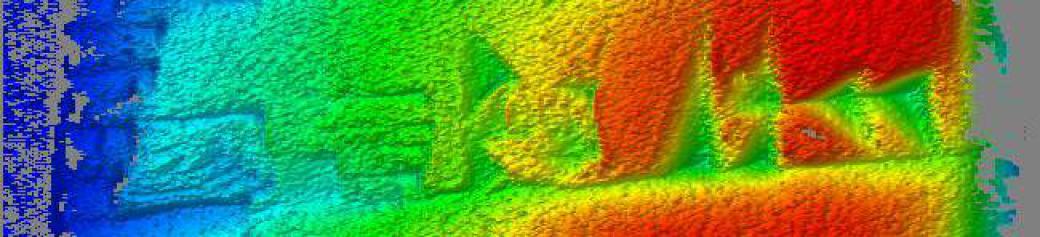
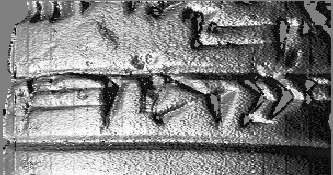
These images show data from a modern turned pot and a cast of a cuneiform tablet in the collection of the Oriental Institute in Chicago Illinois. The tablet is used as a test target on the histogram equalization page. Dimensions of the tablet are approximately 42mm x 36mm x 17mm.
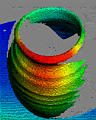
Modern clay pot
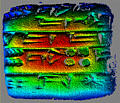
Since our data analysis tools allow the user to extract small regions of interest, and to continue the geometric analysis just on those regions, it seems that it would be possible to measure 3-D shapes of individual signs or their components, possibly leading to a tool for paleography.
For many more results using cuneiform tablets, see these pages:
Adaptive local extrema equalization (automatically highlighting signs)
Adaptive histogram equalization (applied to both conventional 2-D imagery and also to range map visualization imagery)
Raytracing results for cuneiform tablets
Further Ideas for Archaeological Visualization
The article "Visualization of LiDAR terrain models for archaeological feature detection" [B.J. Devereux, G.S. Amable and P. Crow, Antiquity v82 (2008), pp 470-479] suggests a very interesting idea.
Use the 3-D range model to generate raytraced imagery with varying lighting models. For example, if you imagine that the above image of a cuneiform tablet is looking straight down, with north at the top of the image, you can see that the surface is illuminated by a source in the south-west, about 45° above the horizon. Some additional features would be visible if it had been illuminated from another direction, but at the expense of losing some features visible here.
Generate 16 such images, from the same viewpoint but with the illumination source N, NE, E, SE, S, SW, W and NW.
The resulting 16 images would collectively do a good job of capturing more small-scale surface shape features. However, that would be 16 times as much data and 16 times as much analysis work!
So, do Principal Components Analysis, resulting in a new set of 16 images. Most of the information will be captured in the first few such images. Use them individually, or generate false-color imagery by encoding the first three images as red, green, and blue planes of a single image.
They show results for LiDAR (that is, laser radar) data for an Iron Age hill fort. The original data had previously had its vegetation removed as described in earlier work. ["The potential of airborne LiDAR for detection of archaeological features under woodland canopies", [B.J. Devereux, G.S. Amable, P. Crow and A. Cliff, Antiquity v79 (2005), pp 660-]
They found that the first principal component image contained 55.4% of the variation (that is, the information), the first three contained 98.82%, and the first four contained 99.45%.