
Integrating Range Data from Multiple Viewpoints
Multi-Viewpoint Integration
Work is underway to register range maps scanned from different viewpoints into a single 3-D model. A human observer selects landmark points commonly visible from pairs of viewpoints (see the page on range map analysis for an overview of the software involved). The 3-D locations of those landmarks are used to transform one range map so that its landmarks are coincident with the corresponding landmarks in a second range map.
In a bit more detail, you start with two range maps for the same specimen, gathered from different viewpoints or with the specimen oriented differently. The user selects a set of landmarks from viewpoint #1, and assigns them labels. The user then selects a set of landmarks from viewpoint #2, and assigns them labels such that if the same landmark appeared in both range maps, it is given the same label. The system then uses the commonly-visible subset of landmark positions to find a transform that translates and rotates the second range map so that the commonly visible landmarks are coincident. Well, really so that they are maximally coincident, or so that the average error is minimized. Sensor resolution, sensing error, and landmark selection error will combine to guarantee that no two sets of landmarks can ever be transformed to be precisely coincident. Work that remains in this area includes:
- Use subsets of the commonly visible landmarks to discover and disregard outliers.
-
Use local geometric characteristics of landmarks
to increase or decrease confidence.
There are limitations:
- Landmarks within smoothly-curving, or even nearly planar, surfaces were probably measured to a high degree of accuracy. However, the user probably does not consistently select the same landmark point in such a featureless region.
- Landmarks near edges, at the base of pits or the tips of spikes, along the edge of the measured surface, or otherwise in areas of high curvature will be more consistently and precisely selected by the user. However, those points are probably measured less accurately, and self-occlusion may mean that the apparent landmark in the range map does not quite correspond to the physical landmark itself as it was not actually measured.
- Finally, and this is the most challenging, the system could analyze the global and local 3-D shape and highlight small regions deemed useful for merging. For instance, they might have relatively higher curvature, yet be thought more trustworthy than more extreme curvature or edges due to the local topology and topography. Although those landmarks might be uninteresting to the human analyst, the user would encouraged to also select those landmarks for improved registration. See the page on adaptive local extrema detection for the latest work in this area.
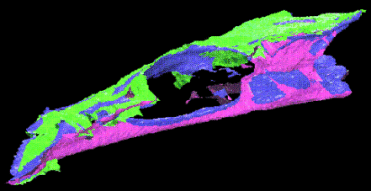
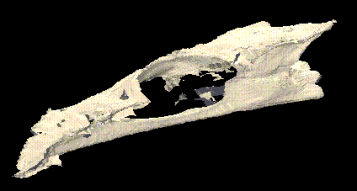
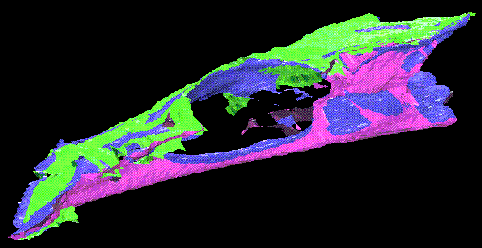
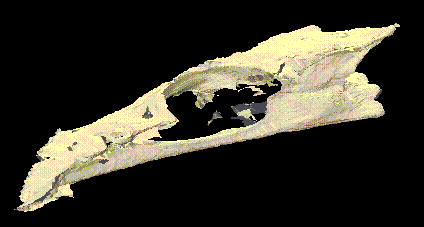
The above describes how to register two range maps. Once you can register two together, you can register any number — just register the n'th to the composite of the previous (n-1). Below are initial results for merging three range maps of a Neomerinthe hemingwayi skull, then raytracing them with a Silicon Graphics workstation. In the first image, the facets were texture-mapped with color to indicate the scan from which they originated. Green regions came from the dorsal view, blue regions from the lateral view, and purple regions from the ventral view.

Color-coded combination of three Neomerinthe hemingwayi range maps

Uniformly colored combination of three Neomerinthe hemingwayi range maps
Of course, all facets can be given more realistic reflectance models, as in the second image.
Current work raytraces the data using the POV-Ray (tm) package running on an Intel or Alpha platform running Linux. The image quality is excellent, and POV-Ray provides a portable solution not tied to SGI hardware. Another alternative would be to use the OpenGL raytracing libraries, although they need specialized video hardware acceleration to realize the full benefit. We want to make our system as portable as possible, with a eye to low-cost solutions.