Software for Range Map Analysis
Range Map Analysis Software
The intent is to use this data collection and analysis method for computer-aided human analysis of non-industrial objects. An advantage over CT or MRI data is the much lower cost. The user is presented with an image, similar to a photograph or reconstructed CT image. Mouse clicks select landmark points, borders of regions of interest, and via points on 3-D space curves. When the user is happy with the selections, the following analysis is recorded:
- The 3-D position and local surface orientation of landmarks,
- Distances between all pairs of landmark points.
- Geometric descriptions of selected 3-D space curves.
- Geometric descriptions of selected 3-D surface regions.
- An image showing the selected landmarks, space curves, and regions as an overlay on the 3-D surface.
-
Archival information:
- The name of the user.
- The time and date that analysis was done.
- The location of the original archival 3-D datafile.
Software is under development to allow "browsing" of a range map, selecting landmarks of interest, and producing reports that detail the 3-D characteristics of points, paths along surfaces, and regions. At left is a thumbnail image of the screendump, a full-sized image appears below.
Features of the interface include the following, where bold items are already in place. After working on the interface for only about eight days, all the functionality of the previous Xlib-based package had been duplicated or exceeded. A testament to the rapid development possible under Tcl/Tk!
-
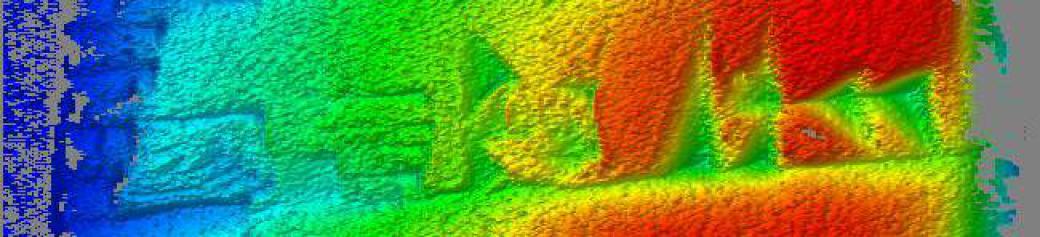
Select among five visualization image types
- Depth-as-hue, overlaid on a 3-D rendering map
- Depth-as-hue
- Depth-as-intensity
- 3-D rendering
- Registered intensity
- Control image characteristics
- Turn on/off landmark labeling
- Turn on/off grid or truss joining landmarks
- Select the color used for labels, landmark crosshairs, and grid lines.
- Take an action
- Select a landmark by clicking on it
- Zoom in on a region of interest, to arbitrary magnification (landmarks can be selected while zoomed in)
- Zoom back out again
- Fine-tune a landmark location by a few pixels
- Click-and-drag to define a border
- Discard a selected landmark
- Assign label text to landmarks
- Perform analyses and save results
- Perform usual landmark analysis
- Save a user-selected border path (space curve) as a Portable Range Map
- Save the region within a user-selected border path as a Portable Range Map